우노
[ML] 생성한 데이터셋으로 다중클래스 분류 (다층퍼셉트론 모델) 본문
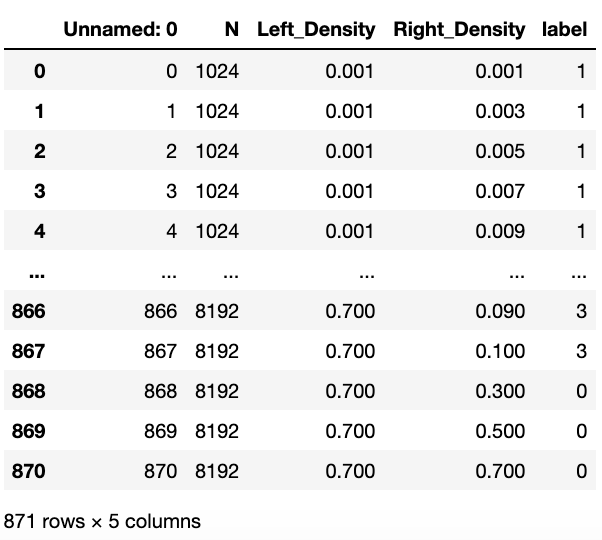
csv 데이터를 읽어와 DataFrame 생성
  import pandas as pd

  df = pd.read_csv('./spmm dataset 1024 2048 4096 8192.csv')
  df
DataFrame에서 data와 label을 분할해 numpy 배열로 생성
data = df.values[:,1:4] label = df.values[:,4]label에 따른 target_names 생성
import numpy as np target_names = np.array(['spark sm*dm','breeze sm*sm','breeze sm*dm','breeze dm*sm'])데이터셋을 훈련세트와 테스트세트로 나눈다.
scikit-learn은 데이터셋을 섞어서 나눠주는 train_test_split 함수를 제공합니다.
- 이 함수는 전체 행 중 75%를 훈련 세트로, 나머지 25%는 테스트 세트로 만들어줍니다.
- scikit-learn에서 데이터는 대문자 X로 표시하고 레이블은 소문자 y로 표기합니다.
train_test_split 함수로 데이터를 나누기 전에 유사 난수 생성기를 사용해 데이터셋을 무작위로 섞어야 합니다.
- 이 함수를 여러 번 실행해도 결과가 똑같이 나오도록 유사 난수 생성기에 넣을 난수 초깃값을 random_state 매개변수로 전달합니다.
- 이렇게 하면 이 코드는 항상 같은 결과를 출력합니다.
클래스별로 확률값을 지정하기 위해서는 label을 “one-hot 인코딩”으로 사용
클래스별 확률값의 합은 1.0 이다.
  from sklearn.model_selection import train_test_split

  X_train, X_test, y_train, y_test = train_test_split(
      data,label,random_state=0
  )

  from keras.utils import to_categorical

  y_train = to_categorical(y_train, num_classes=4) # one-hot 인코딩
  y_test = to_categorical(y_test, num_classes=4) # one-hot 인코딩
train, test 데이터셋 출력
1차원 shape : (숫자, )
2차원 shape : (숫자, 숫자)
print("X_train 크기: {}".format(X_train.shape))
print("y_train 크기: {}".format(y_train.shape))
print("X_test 크기: {}".format(X_test.shape))
print("y_test 크기: {}".format(y_test.shape))
X_train 크기: (653, 3) y_train 크기: (653, 4) X_test 크기: (218, 3) y_test 크기: (218, 4)
다층 퍼셉트론 신경망 모델 생성
활성함수 relu는 오류역전파가 용이하다.
활성함수 softmax는 입력되는 값을 클래스별 확률값이 나오도록 출력시킵니다.
이 확률 값을 모두 더하면 1이 됩니다.
다중 클래스 모델의 출력층에 주로 사용되며, 확률값이 가장 높은 클래스가 모델이 분류한 클래스입니다.
from keras.models import Sequential
from keras.layers import Dense
from keras.optimizers import Adam

model = Sequential()

# 입력은 3개 특성값을 가진 1차원 벡터
model.add(Dense(64,input_shape=(3,),activation='relu'))

# 활성함수 relu
model.add(Dense(64,activation='relu'))

# 출력은 4가지 클래스별 확률값을 가진 1차원 벡터
# 활성함수 softmax
model.add(Dense(4,activation='softmax'))

# 모델 학습 과정 설정
model.compile(loss='categorical_crossentropy',
            optimizer='Adam',
            metrics=['accuracy'])

model.summary()
모델 훈련
history = model.fit(X_train, y_train, epochs=1000, batch_size=128)학습과정 살펴보기
  %matplotlib inline
  import matplotlib.pyplot as plt

  fig, loss_ax = plt.subplots()

  acc_ax = loss_ax.twinx()

  loss_ax.set_ylim([0.0, 3.0])
  acc_ax.set_ylim([0.0, 1.0])

  loss_ax.plot(hist.history['loss'], 'y', label='train loss')
  acc_ax.plot(hist.history['accuracy'], 'b', label='train acc')

  loss_ax.set_xlabel('epoch')
  loss_ax.set_ylabel('loss')
  acc_ax.set_ylabel('accuray')

  loss_ax.legend(loc='upper left')
  acc_ax.legend(loc='lower left')

  plt.show()
모델 평가하기
  loss_and_metrics = model.evaluate(X_test, y_test, batch_size=32)
  print('loss_and_metrics : ' + str(loss_and_metrics))
7/7 [==============================] - 0s 2ms/step - loss: 0.7642 - accuracy: 0.6743 loss_and_metrics : [0.76421058177948, 0.6743119359016418]
'AI > Machine Learning' 카테고리의 다른 글
| [ML] 회귀 분석 (Regression Analysis) 의 개념과 학습 흐름 (0) | 2020.07.29 |
|---|---|
| [ML] K-최근접 이웃 (K-Nearest Neighbor)이란? (0) | 2020.07.28 |
| [ML] 생성한 데이터셋으로 다중클래스 분류 (K-NN 모델) (0) | 2020.07.25 |
| [ML] Iris 데이터셋을 사용한 다중클래스 분류 (K-NN 모델) (1) | 2020.07.24 |
| [ML] Tensorflow 와 Keras 간단 비교 (3) | 2020.07.23 |
Comments


